
6 Interactive Prototype Screens

A look at the app

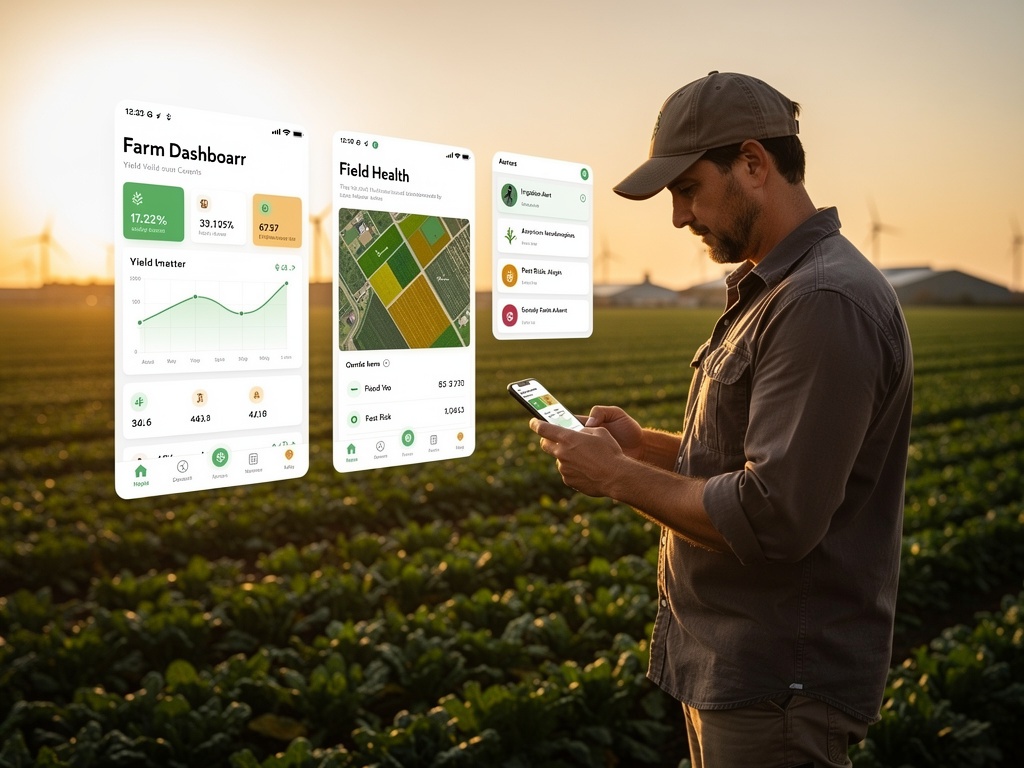
Preview screens using sample data. The product is in beta development and features will change.
Start with Dashboard Join the Waitlist
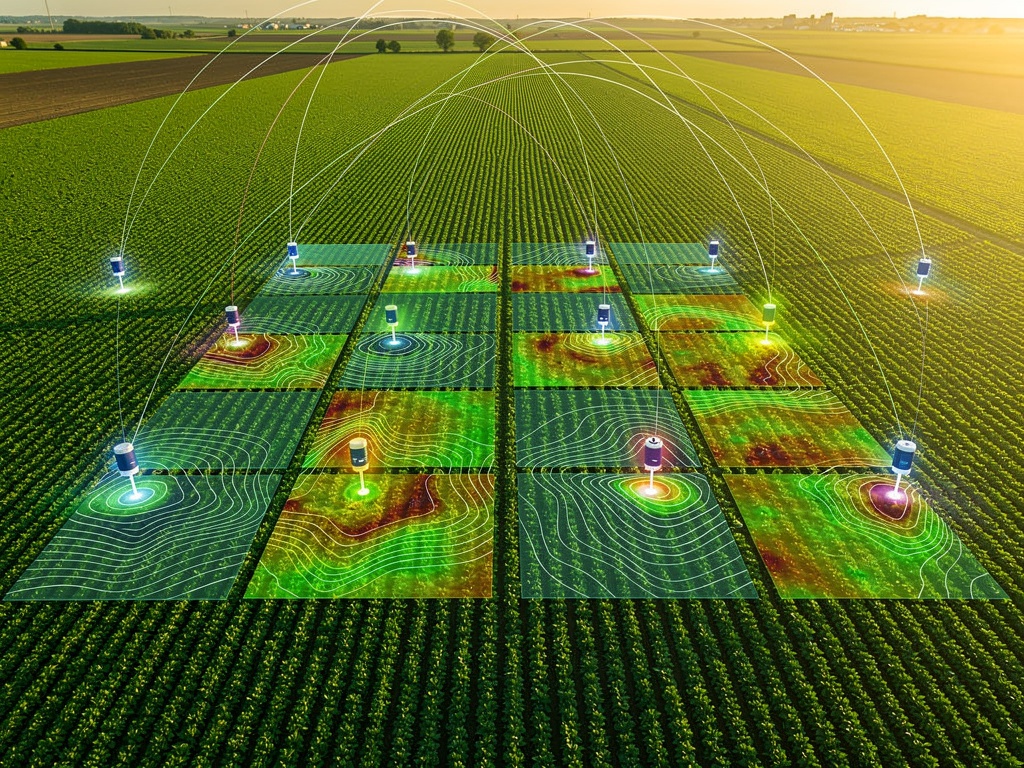
Smart farming dashboard showing weather, irrigation and planting data over agricultural fields
Field Telemetry Dashboard
Weather bar NDVI Field Map Yield Trend Chart Crop Rotation Timeline
Screen 01

Field Telemetry Dashboard

Sample dashboard layout: weather summary, field health map, and yield trend — illustrative data only.
Weather bar
Temperature, humidity, wind, 7-day precipitation strip, GDD accumulation counter, and frost risk chip — sourced from hyper-local IoT weather station.
NDVI Field Map with Zone Pins
Switchable satellite layers (NDVI / RGB / Water Stress / Thermal) with clickable zone pins and a field list panel showing all 7 managed parcels.
Sensors (optional)
If you already have field sensors, they can be integrated — not required for the beta.
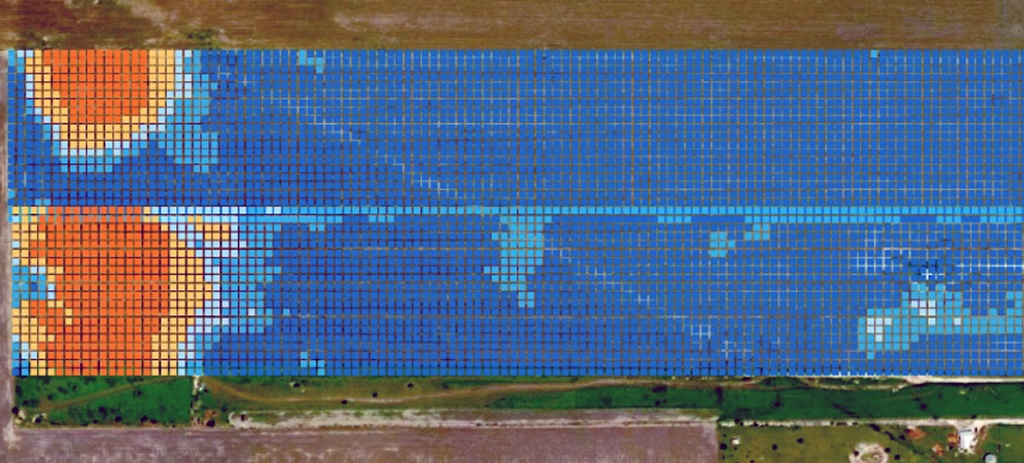
NDVI satellite crop health analysis showing vegetation index maps across farmland
NDVI Crop Intelligence
Zone NDVI Scores Digital Twin KPIs Field-zone grid Scan History Table Dual-Axis Chart
Screen 02

Crop Intelligence & NDVI Analysis

The deepest field intelligence in the platform. Zone-by-zone NDVI scoring, a 12×12 field-zone grid representing high resolution satellite imagery pixels, digital twin metrics, and full scan history with satellite metadata.

5-Zone NDVI Analysis Panel
Each zone shows NDVI score (0–1), week-on-week trend, status badge, and specific agronomic recommendation — from "Continue schedule" to "Immediate irrigation failure inspection."
Digital Twin — sample KPIs
GDD 1,842°C·day · R4 Growth Stage · Yield Forecast 8.4 t/ha · Harvest Sep 14 · Field Capacity 84% · Stress Level Low — all updated per scan cycle.
144-Cell Field-zone grid
Visual 12×12 matrix representing 10m×10m high resolution satellite imagery pixels — colour-coded green/yellow/orange/red by NDVI value, providing sub-field spatial awareness at field-zone scale.
Sample data
NDVI −0.24 · Zone 7
Aphid Risk 74/100 · Sample data
FC 18% ↓
high resolution satellite imagery Synced
Filter Pills 3 sample alerts Pest Radar Chart · Coming soon 5×5 Risk Matrix 7-Day Forecast
Screen 03

Alerts & Risk Management

Sample alerts for irrigation stress. Pest and frost alerts: Coming soon.
Sample: possible irrigation problem
Illustrative alert — lower NDVI in one zone; scout and check irrigation. Sample data.
Pest alerts
Coming soon.
Frost alerts
Coming soon.
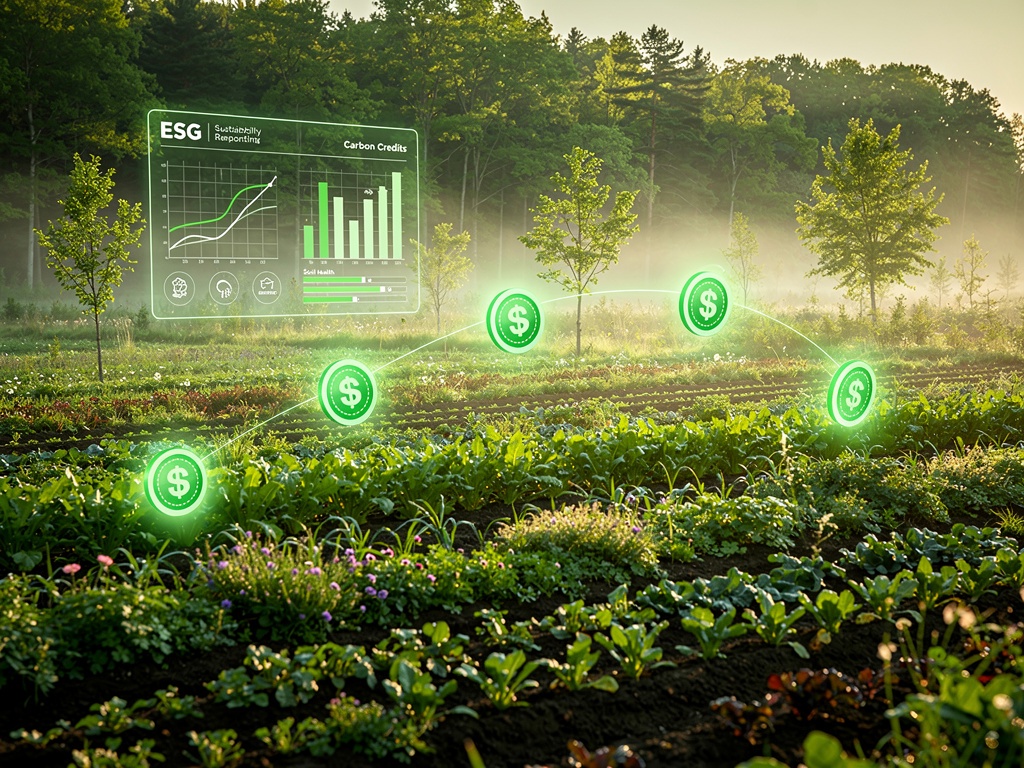
Regenerative agriculture field
Carbon pathway
Coming soon
Screen 04

Carbon pathway

Carbon pathway – coming soon. We're working with top bio-credit frameworks to create a road to premium carbon credits.
Join the VersaAgro waitlist
Join the Waitlist
Waitlist

Join the Waitlist

Tell us about your crops and acres. Selected growers receive field-level data going back 10 years within a week, plus founding-grower pricing.
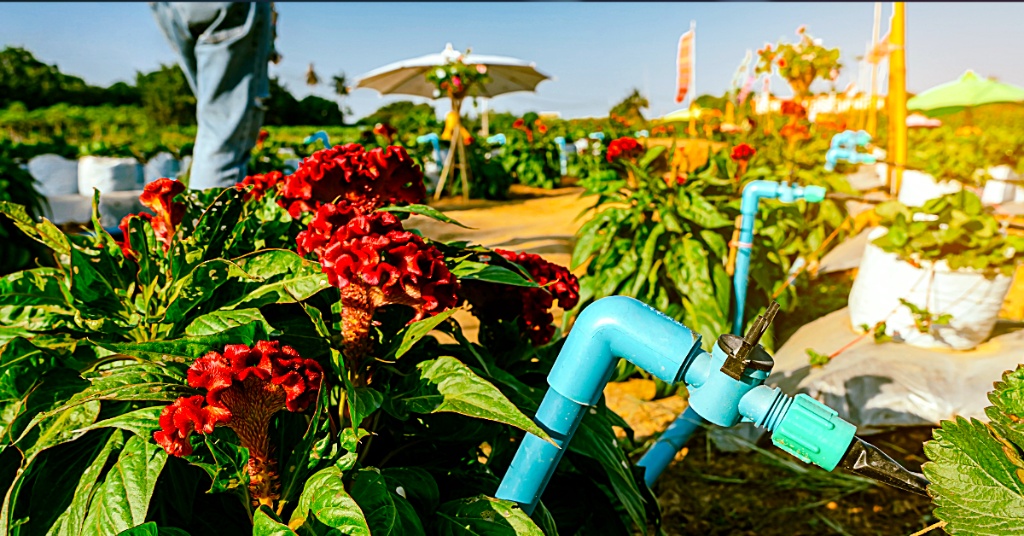
Precision drip irrigation system with blue PVC fittings among blooming celosia flowers — Irrigation Intelligence Screen
Sample data
⚠ Zone 1 — 18% FC
6.2mm
ET₀ Demand
3 Active
Zones Running
Irrigation Intelligence
Optional sensors FAO ET₀ Model Guidance Zone Map Water balance
Screen 07

Irrigation Intelligence

Irrigation guidance from your current water balance and the 14-day forecast — expert-guided, not automated scheduling.

Irrigation guidance
We review your current water balance and the 14-day forecast and give specific recommendations on when and how much to water — expert-guided, not automated scheduling.
Quick Navigation

Explore the site

All screens show sample data.

Ready to see it on your fields?

Join the waitlist – spots are limited. Selected growers receive field-level data going back 10 years within a week, plus founding-grower pricing.