Navigate to
PlatformPage
Crop IntelligencePage
ForestryPage
Grower's RevenuePage
Join the WaitlistForm
Privacy PolicyLegal
Up to daily satellite imagery, so you see changes in your fields as they happen. VersaAgro turns that imagery into yield forecasts, harvest timing and early stress warnings.
Clouds can delay imagery.
From raw satellite pixels to precise field interventions — four integrated steps powered by patented algorithms and dual-source data validation.
We collect high resolution satellite imagery of your fields up to daily and clean out clouds.
NDVI = (NIR − Red) / (NIR + Red) computed per 10m × 10m pixel. Multi-temporal compositing across 6 scan dates eliminates cloud contamination. Anomaly detection flags cells with >0.15 week-on-week NDVI decline.
Already have in-field sensors? We can bring that data in too — optional ground truth on top of satellite imagery.
Each scan cycle updates the field's digital twin: GDD accumulation refreshes, growth stage transitions, yield forecast recalibrates, and harvest window prediction narrows as the season progresses.
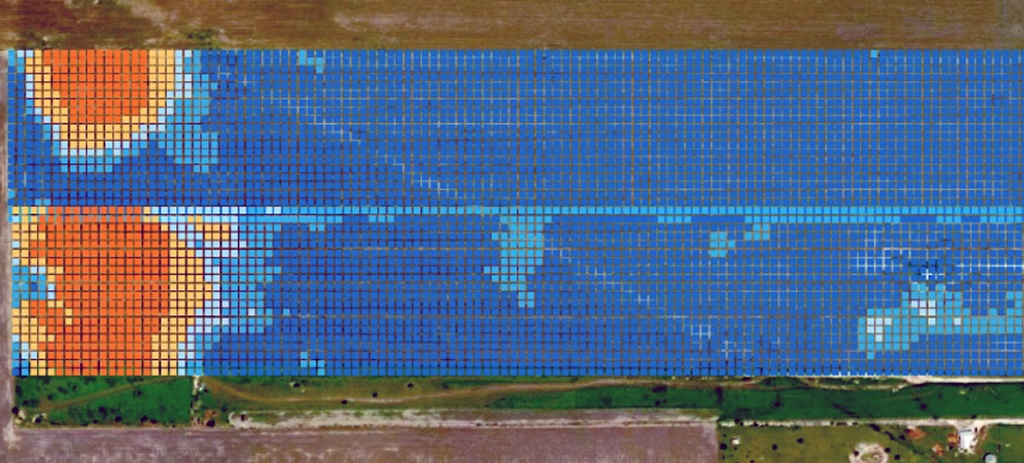
Illustrative zones from a sample field layout. Each zone corresponds to a distinct NDVI region from satellite imagery.
| Zone | Area (ha) | NDVI Score | NDVI Trend | Soil FC % | Status | Recommended Action |
|---|---|---|---|---|---|---|
| Zone A — North West | 218 ha | +0.031 vs last scan | 87% | Optimal | Continue current schedule. Monitor GDD accumulation. | |
| Zone B — North East | 192 ha | +0.008 stable | 79% | Good | Monitor NDVI trend in this zone. Forecast: Harvest Sep 16. (Sample data) | |
| Zone C — South Centre | 165 ha | −0.118 declining | 52% | Moderate Stress | Increase irrigation run-time by 35%. Foliar inspect by Day 3. | |
| Zone D — South West | 147 ha | −0.240 critical | 18% | Possible irrigation problem – inspect | Possible irrigation problem — inspect. Illustrative zone only; not a live field alert. | |
| Zone E — East Block | 125 ha | +0.017 improving | 74% | Good | Recovery trend confirmed. Continue supplemental irrigation. |
Every scan cycle updates the field's digital twin parameters — giving you a continuous physiological model of each crop's development state and yield trajectory.
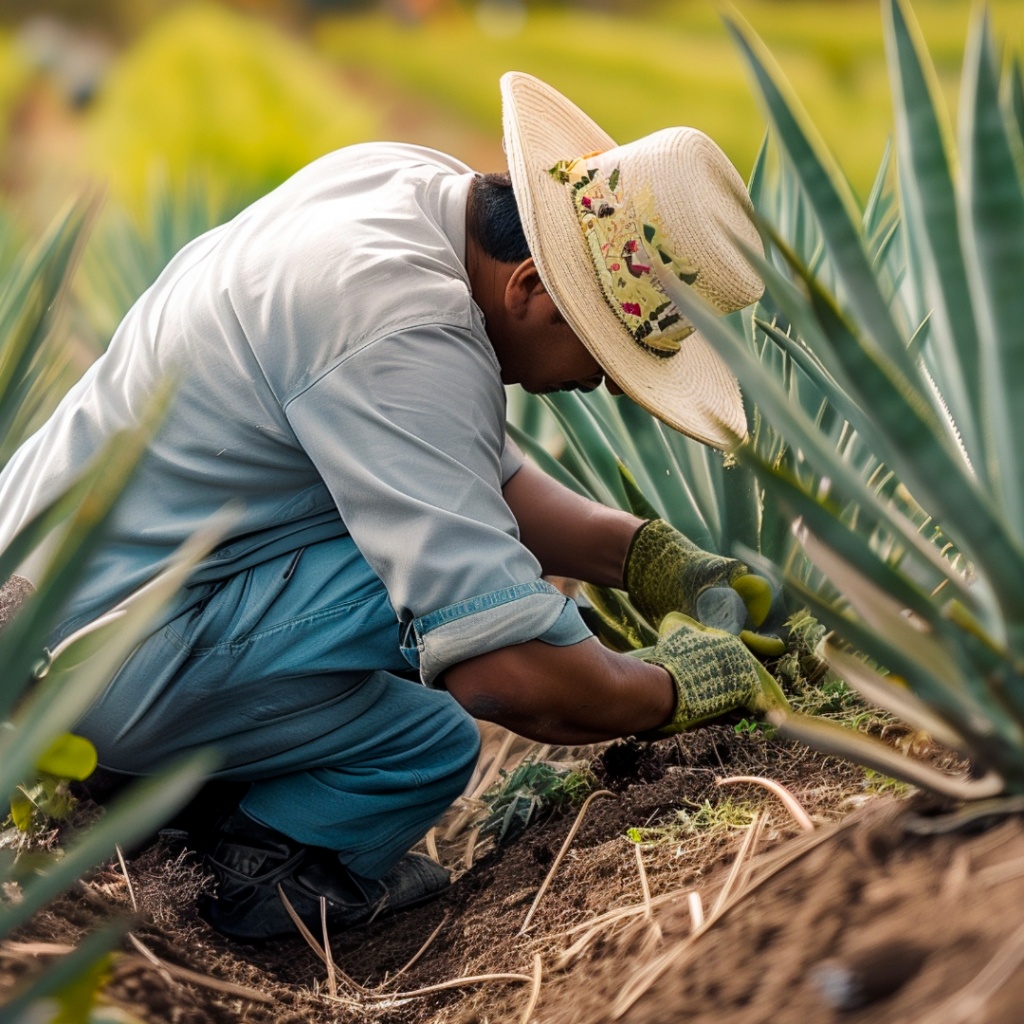
Built for 25+ crops, from cotton and corn to coffee, agave and avocado.
Within 1.5% of actual yield in multi-year university trials (cotton and sorghum). Crop models are added and refined as growers join the beta.
High resolution satellite imagery, cleaned for clouds, at field scale.
| Spatial resolution | 10 m × 10 m SuperRes AI option — 1 pixel = 2 m |
| Imagery cadence | Up to daily (weather and clouds permitting) |
| NDVI | Plant greenness index from satellite reflectance |
| Optional sensors | Integrate ground sensors you already own |
| Yield accuracy* | Within 1.5% of actual yield in multi-year university trials |
*Individual results vary. Not a guarantee.
Selected growers receive field-level data going back 10 years within a week, plus founding-grower pricing.